How Much Do Postal Service Mail Sorters and Processors Make? 2025 Pay by Percentile, State, City and Industry
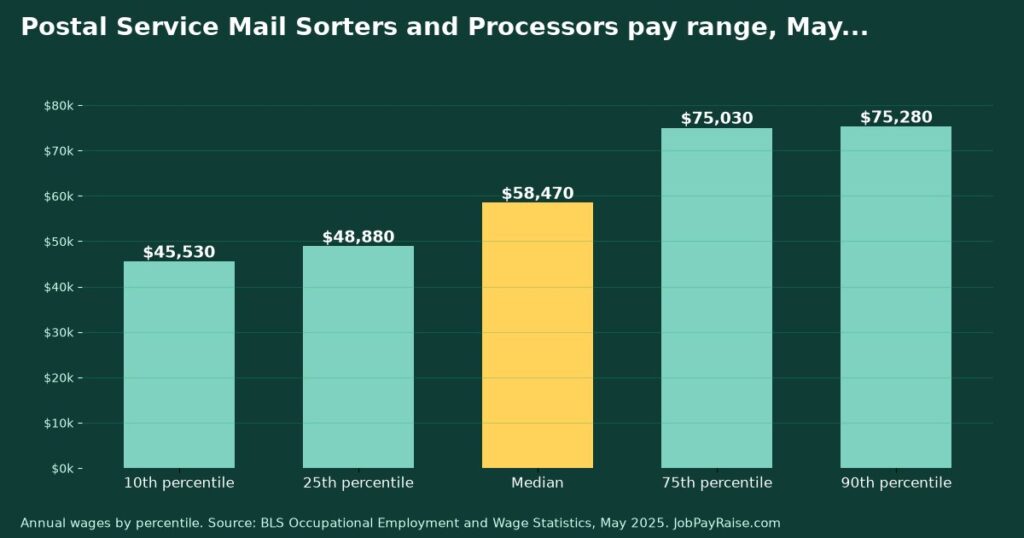
- The median annual wage for postal service mail sorters and processors was $58,470 in May 2025 ($28.11 an hour), compared with $50,980 for all U.S. occupations.
- The lowest-paid 10% earned less than $45,530; the top 10% earned more than $75,280.
- BLS projects employment to change by -5.3% from 2025 to 2035, with about 7.3 thousand openings a year.
About 105,200 people worked as postal service mail sorters, processors, and processing machine operators in the United States in May 2025, according to the federal government’s BLS OEWS national data, May 2025. Here is what they earn, from entry level to the top of the field, and where the pay is highest. Projections and training requirements come from the BLS Occupational Outlook Handbook: Postal Service Mail Sorters, Processors, and Processing Machine Operators and BLS Employment Projections, 2025–35.
The full pay range
| Percentile | Hourly | Annual |
|---|---|---|
| 10th (entry level / lowest paid) | $21.89 | $45,530 |
| 25th | $23.50 | $48,880 |
| 50th (median) | $28.11 | $58,470 |
| 75th | $36.07 | $75,030 |
| 90th (most experienced / best paid) | $36.19 | $75,280 |
| Mean (average) | $28.57 | $59,430 |
A percentile wage means that share of workers earn less. For example, 25% of postal service mail sorters and processors earned less than $48,880. BLS wage estimates do not include overtime, tips or most bonuses.
States where postal service mail sorters and processors earn the most
Highest state medians in the May 2025 survey (state data):
| State | Median annual wage | Employment |
|---|---|---|
| District of Columbia | $66,750 | 400 |
| South Dakota | $61,570 | 210 |
| Iowa | $60,530 | 1,040 |
| New Jersey | $60,530 | 3,660 |
| Wyoming | $60,530 | 120 |
At the other end, the lowest state medians were in Indiana ($48,880), Georgia ($53,290), Kansas ($54,540). Lower-paying states often have lower living costs, so compare offers with local prices in mind.
Top-paying metro areas
Metro areas with at least 300 jobs in this occupation, ranked by median wage (metro data):
| Metro area | Median annual wage | Employment |
|---|---|---|
| San Francisco-Oakland-Fremont, CA | $63,650 | 1,510 |
| Des Moines-West Des Moines, IA | $60,530 | 840 |
| San Diego-Chula Vista-Carlsbad, CA | $60,200 | 740 |
| Sacramento-Roseville-Folsom, CA | $60,200 | 1,140 |
| San Jose-Sunnyvale-Santa Clara, CA | $60,200 | 420 |
How to get into the field
- Typical entry education: No formal educational credential.
- Work experience in a related occupation: none.
- Typical on-the-job training: Short-term on-the-job training.
These are the typical requirements BLS assigns to the occupation in its BLS Employment Projections, 2025–35 tables; employers and state licensing boards may require more. The BLS Occupational Outlook Handbook: Postal Service Mail Sorters, Processors, and Processing Machine Operators explains licensing and certification in detail.
Using these numbers to ask for a raise
- Find your band. If you earn less than $48,880, you are in the bottom quarter nationally. If you have several years of experience, that is a fact worth raising in a pay review.
- Use local data, not national. State and metro medians above can be far from the national $58,470. Quote the figure for your area.
- Compare industries. If another sector pays your occupation more, that is useful leverage, or a sign it may be worth moving.
- Count the whole package. These figures exclude overtime and benefits, so compare total compensation when weighing an offer.
Published November 9, 2026. Sources are linked in the text.
Header image: original chart by JobPayRaise.com using BLS OEWS May 2025 data.
Comments (1)
One more data point: the metro area where postal service mail sorters and processors are most concentrated is Springfield, MA, with a location quotient of 7.72 and 1,050 jobs at a median of $54,540. A location quotient above 1 means the job is a bigger share of local employment than it is nationally, which usually means more employers competing for experienced workers. Source: BLS OEWS metropolitan-area data, May 2025.
— JobPayRaise Data Desk