Chefs vs. Bakers: Pay, Job Outlook and Training Compared (2025 BLS Data)
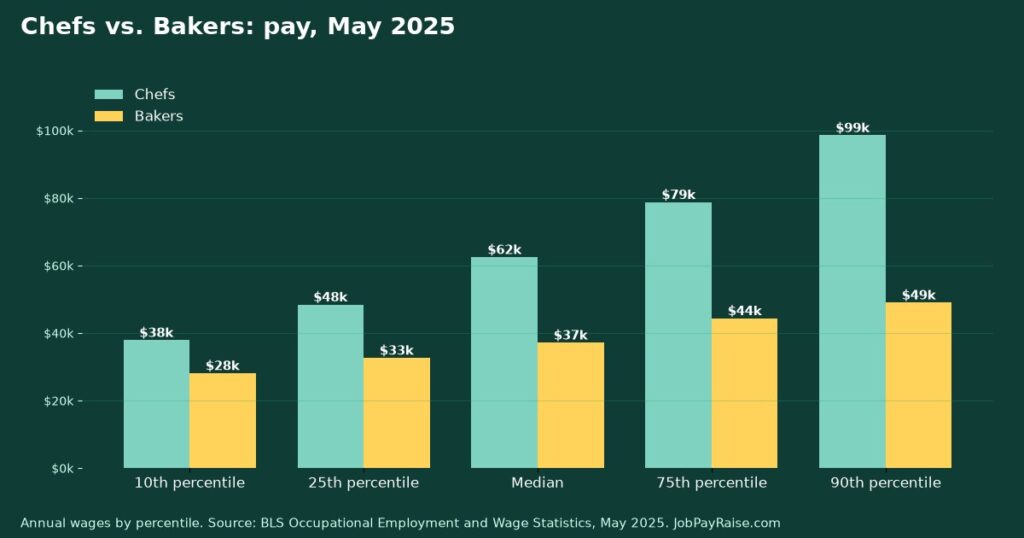
- Chefs had the higher median annual wage in May 2025: $62,470, versus $37,160 for bakers.
- There are more bakers: about 236,200 U.S. jobs, versus 200,040 for chefs.
- BLS projects employment of chefs to change by 6.6% and employment of bakers by 5.5% from 2025 to 2035.
Choosing between chefs and bakers, or thinking about switching? This side-by-side uses the federal government’s BLS OEWS national data, May 2025 for pay and job counts and BLS Employment Projections, 2025–35 for growth, openings and typical entry requirements. BLS occupation titles: “Chefs and Head Cooks” (SOC 35-1011) and “Bakers” (SOC 51-3011). More detail: Chefs (BLS) and Bakers (BLS).
Pay side by side
| May 2025 | Chefs | Bakers |
|---|---|---|
| U.S. jobs | 200,040 | 236,200 |
| 10th percentile (annual) | $37,900 | $28,120 |
| 25th percentile | $48,440 | $32,660 |
| Median (annual) | $62,470 | $37,160 |
| Median (hourly) | $30.03 | $17.86 |
| 75th percentile | $78,750 | $44,360 |
| 90th percentile | $98,560 | $49,020 |
| Mean (average) | $66,700 | $38,480 |
Percentile wages: for example, 10% of workers earn less than the 10th-percentile figure. OEWS wages exclude overtime, tips and most bonuses.
Outlook and how you get in
| BLS Employment Projections | Chefs | Bakers |
|---|---|---|
| Projected job growth, 2025–35 | 6.6% | 5.5% |
| Openings per year (avg.) | 25.2 thousand | 36.5 thousand |
| Typical entry education | High school diploma or equivalent | No formal educational credential |
| Work experience in a related job | 5 years or more | none |
| Typical on-the-job training | none | Moderate-term on-the-job training |
Openings include jobs that open up when workers retire or change occupations, not just new positions, which is why a field with slow growth can still hire a lot of people every year.
Where each job pays best
The three states with the highest median wage for each occupation (BLS OEWS state data, May 2025):
| Rank | Chefs | Bakers |
|---|---|---|
| 1 | Rhode Island – $79,930 | Hawaii – $46,710 |
| 2 | Hawaii – $77,360 | Washington – $46,140 |
| 3 | District of Columbia – $76,420 | District of Columbia – $44,040 |
By industry, chefs earned the highest median in Government (federal, state and local; excludes public schools, public hospitals and the Postal Service) ($86,300) and bakers in Educational Services ($45,800), counting sectors with at least 1,000 jobs in the occupation (BLS OEWS industry data).
Which should you pick?
- Look past the median. Compare the 25th and 75th percentiles too: they show what a typical early-career and an experienced worker earn in each field.
- Count the cost of entry. The education and training rows above tell you how long it takes to start earning. A longer path can still pay off if the pay gap is large.
- Check your area. State pay differs a lot from the national figure; use the state table and your local job ads before deciding.
- Already in one of these jobs? If your pay is below the 25th percentile for your field, that is a concrete number to bring to a raise conversation.
Published November 9, 2026. Sources are linked in the text.
Header image: original chart by JobPayRaise.com using BLS OEWS May 2025 data.
Comments (1)
One more data point, from metro-level data: among metro areas with at least 300 jobs in the occupation, the highest median for chefs was in Albany-Schenectady-Troy, NY ($84,430, 470 jobs), and for bakers it was in Seattle-Tacoma-Bellevue, WA ($48,180, 3,560 jobs). Source: BLS OEWS metropolitan-area data, May 2025.
— JobPayRaise Data Desk