Arts, Design, Media and Sports Jobs: Every Major Occupation’s Pay, Ranked (May 2025 BLS Data)
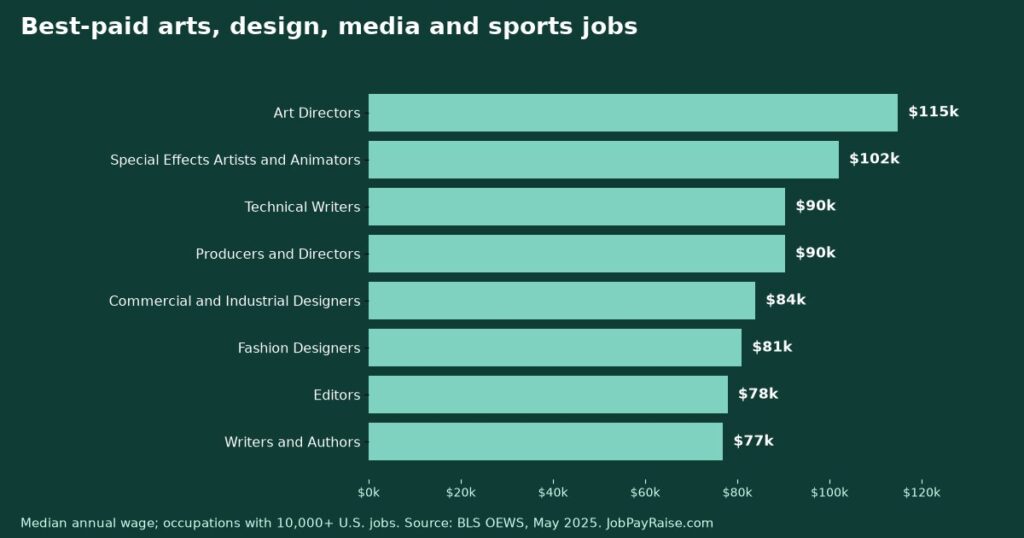
- The median annual wage for arts, design, entertainment, sports and media occupations was $62,750 in May 2025, above the $50,980 median for all U.S. jobs.
- The group employed about 2,046,290 people nationwide.
- Its best-paid occupation with at least 10,000 jobs was art directors ($114,850); the lowest-paid was floral designers ($37,360).
BLS sorts every job in the country into 22 major occupational groups. This one, “Arts, Design, Entertainment, Sports, and Media Occupations” (SOC 27-0000), covers the occupations below. All pay and job counts come from the BLS OEWS national data, May 2025; the typical entry education for each job comes from BLS Employment Projections, 2025–35. Use the tables to see where your job sits in its field and which nearby jobs pay more.
Highest-paying jobs in the group
Occupations with at least 10,000 U.S. jobs, ranked by median annual wage:
| Occupation | Median annual wage | Hourly median | U.S. jobs | Typical entry education |
|---|---|---|---|---|
| Art Directors | $114,850 | $55.22 | 53,070 | Bachelor's degree |
| Special Effects Artists and Animators | $102,030 | $49.06 | 19,970 | Bachelor's degree |
| Technical Writers | $90,390 | $43.46 | 45,500 | Bachelor's degree |
| Producers and Directors | $90,360 | $43.44 | 143,120 | Bachelor's degree |
| Commercial and Industrial Designers | $83,910 | $40.34 | 33,490 | Bachelor's degree |
| Fashion Designers | $80,960 | $38.92 | 21,450 | Bachelor's degree |
| Editors | $77,920 | $37.46 | 91,690 | Bachelor's degree |
| Writers and Authors | $76,910 | $36.98 | 47,940 | Bachelor's degree |
| Film and Video Editors | $75,420 | $36.26 | 25,610 | Bachelor's degree |
| Set and Exhibit Designers | $75,240 | $36.17 | 10,630 | Bachelor's degree |
| Camera Operators, Television, Video, and Film | $74,990 | $36.05 | 21,550 | Bachelor's degree |
| Public Relations Specialists | $74,750 | $35.94 | 283,380 | Bachelor's degree |
Lowest-paying jobs in the group
| Occupation | Median annual wage | U.S. jobs |
|---|---|---|
| Floral Designers | $37,360 | 40,590 |
| Merchandise Displayers and Window Trimmers | $39,390 | 165,220 |
| Umpires, Referees, and Other Sports Officials | $40,710 | 15,780 |
| Photographers | $44,660 | 51,760 |
| Coaches and Scouts | $47,320 | 248,950 |
The most common jobs in the group
These are the occupations most people in this field actually hold:
| Occupation | U.S. jobs | 10th percentile | Median | 90th percentile |
|---|---|---|---|---|
| Public Relations Specialists | 283,380 | $44,110 | $74,750 | $135,150 |
| Coaches and Scouts | 248,950 | $28,790 | $47,320 | $98,860 |
| Graphic Designers | 197,830 | $39,520 | $62,960 | $104,910 |
| Merchandise Displayers and Window Trimmers | 165,220 | $30,760 | $39,390 | $58,370 |
| Producers and Directors | 143,120 | $45,780 | $90,360 | $198,540 |
| Editors | 91,690 | $41,250 | $77,920 | $153,700 |
| Interior Designers | 71,500 | $41,420 | $67,190 | $114,140 |
| Audio and Video Technicians | 70,230 | $37,990 | $58,100 | $100,650 |
Where arts, design, entertainment, sports and media jobs pay the most
States with the highest median wage for the whole group (BLS OEWS state data, May 2025):
| State | Group median wage | Jobs in the group |
|---|---|---|
| District of Columbia | $101,750 | 33,970 |
| New York | $82,250 | 202,830 |
| California | $79,520 | 338,230 |
| Massachusetts | $76,420 | 49,130 |
| New Jersey | $74,390 | 48,470 |
The lowest group medians were in Mississippi ($43,580), Arkansas ($44,220), West Virginia ($45,830). Part of the gap reflects living costs and part reflects which jobs in the group are common in each state.
No bachelor’s degree? The best-paid job in this group with a typical entry requirement below a four-year degree was sound engineering technicians, at a median of $73,130 (postsecondary nondegree award typically needed).
How to use this for a raise or a move
- Benchmark inside your field. Find your occupation in the tables and compare your pay with its median and with the 10th and 90th percentiles.
- Look one step over. The best-paid jobs in a group often use the same skills as the common ones. A certificate or license can move you up a row.
- Location matters. The state table shows how much the same kind of work pays in different places.
- Base pay only. OEWS wages exclude overtime, tips and most bonuses.
Published October 29, 2026. Sources are linked in the text.
Header image: original chart by JobPayRaise.com using BLS OEWS May 2025 data.
Comments (1)
One more data point: the state where arts, design, entertainment, sports and media jobs make up the largest share of local employment is District of Columbia, with a location quotient of 3.68 (33,970 jobs at a group median of $101,750). A location quotient above 1 means the group is a bigger share of the state’s jobs than it is nationally. Source: BLS OEWS state data, May 2025; location quotients are explained in the BLS OEWS overview.
— JobPayRaise Data Desk